
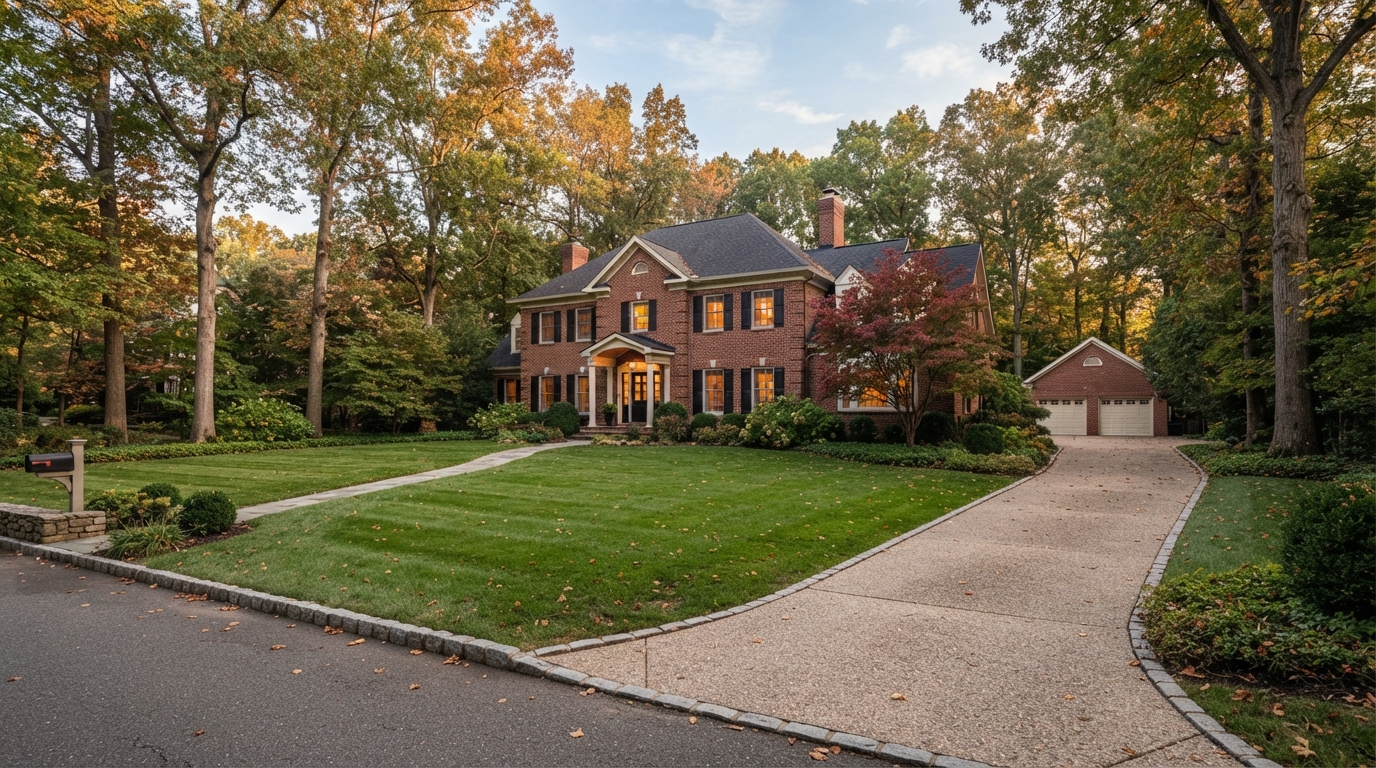
Your Listing Was Not Overpriced Per Square Foot (Part 4 of 30: The Fort Washington Files)
This is Part 4 of The Fort Washington Files from Donnell Williams Jr. and DMV Prime Properties, a thirty-part series built entirely on what 689 Fort Washington listings actually did in 2026. Parts 1 through 3 established the failure rate, the days-on-market cliff, and what a price cut costs. This part addresses the finding that surprised Donnell most when he ran the export, and it changes how a Fort Washington seller should think about the word "overpriced."
When a listing fails, everyone reaches for the same explanation. It was overpriced. The seller was unrealistic. The agent should have pushed harder on the comps. That explanation is satisfying because it is simple, and in Fort Washington in 2026, the data says it is not quite right.
The number that should have exposed the failures, and did not
Price per square foot is the standard tool for testing whether a listing is out of line. Take the asking price, divide by the finished above-grade square footage, and compare it to what similar homes are getting. A listing that is 15% high per foot is a listing in trouble.
So Donnell ran it across both groups in his Bright MLS export covering 689 Fort Washington listings tracked through September 17, 2026.
The 144 listings that failed to sell asked a median of $267 per square foot on their original list price.
The 361 listings that closed asked a median of $273 per square foot on their original list price.
The failures were asking less per square foot than the homes that sold. Not dramatically less, but less. Whatever separated these two groups, it was not a per-foot premium. If a seller had run that single test in advance on a typical failed Fort Washington listing, the test would have come back clean.
The failures were bigger houses
Here is the other half of it. The 144 failed listings had a median above-grade square footage of 1,952. The 361 closed sales had a median of 1,716.
Those two facts fit together in only one way. If the failures asked slightly less per square foot but had meaningfully more square footage, then their total asking price had to be higher. And it was: a median original list price of $534,748 for the failures against $479,900 for the closings.
So the typical Fort Washington listing that failed was a larger home, priced at a defensible rate per foot, carrying a total number well above what the typical Fort Washington home sold for.
For reference, the 361 closed sales had a median sale price of $470,000 and an average of $497,372, with a median of $265 per square foot on the sale price. The median closed home was built in 1976, sat on 0.28 acres, and had four bedrooms. That is the center of gravity in this zip code, and it is the standard a larger listing is implicitly measured against.
What the data actually shows, stated carefully
Donnell wants to be precise here, because this is the kind of finding that gets stretched.
The export does not prove that every failed listing failed because of its total price. It cannot. Listings fail for many reasons, including condition, timing, a seller who changed plans, financing that fell apart repeatedly, or a property type with a naturally small audience. The 144 failures include 79 expired, 43 canceled, and 22 withdrawn, and those are not all the same situation.
What the export shows is this: the per-square-foot test, which is the test most sellers and many agents rely on, did not distinguish the failures from the successes in Fort Washington. The total price did. That is a narrower claim than "big houses do not sell here," and it is the claim the data supports.
Where the buyer pool has depth, and where it thins
If total price is the variable that separated the two groups, then the failure rate should climb as total price climbs. It does, though not in a perfectly straight line.
Broken out by original list price band across all 505 finished Fort Washington listings:
- Under $300,000: 9 failed against 21 closed, a 30.0% fail rate
- $300,000 to $400,000: 17 failed against 80 closed, 17.5%
- $400,000 to $500,000: 34 failed against 116 closed, 22.7%
- $500,000 to $600,000: 32 failed against 65 closed, 33.0%
- $600,000 to $800,000: 33 failed against 66 closed, 33.3%
- Over $800,000: 19 failed against 13 closed, 59.4%
From $300,000 up, the fail rate rises with every band, from 17.5% to 22.7% to 33.0% to 33.3% and then to 59.4%. The band under $300,000 sits at 30.0%, which breaks the pattern at the bottom and is worth its own attention, though with 9 failures and 21 closings it is a small group.
Notice also where the volume is. The $300,000 to $400,000 and $400,000 to $500,000 bands together account for 196 of the 361 closed sales. That is where Fort Washington's buyer pool is deepest. Above $600,000, the combined closings drop sharply.
This is a statement about the distribution of buyer budgets in this zip code. It is not a statement about any neighborhood, and nothing here should be read as one.
Why per-square-foot pricing misleads on larger homes
The decade-built breakdown of the 361 closed sales shows why the per-foot test fails on exactly the homes where sellers most want to use it.
Homes built in the 1960s, 78 closed sales, carried a median price of $459,450 and the highest price per square foot in the export at $310. Homes built in the 2000s, 17 closed sales, carried a median price of $675,000 and the lowest price per square foot at $215. The 1950s came in at $286, the 1970s at $263, the 1980s at $275, and the 1990s at $236.
Read that column top to bottom and a pattern appears. As homes get larger and newer in Fort Washington, the price per square foot goes down, not up. The market is not paying a flat rate per foot and multiplying. It is paying for a house, and each additional square foot is worth progressively less in total dollars.
A seller with a 2,700 square foot home who prices at the $273 per foot that closed sales achieved is not pricing conservatively. Applied at that size, the local per-foot figure produces a total that lands in a band where, per the table above, the fail rate is significantly higher.
The test a Fort Washington seller should run instead
Donnell's substitute for the per-foot check is a counting exercise, and it takes about ten minutes with the MLS open.
Pick the total price you are considering. Then count three things in that price band for Fort Washington in 2026: how many homes closed, how many listings failed, and how many are sitting active right now. Those three counts tell a seller more than any rate per foot.
At $450,000, the counting comes back reassuring. The $400,000 to $500,000 band produced 116 closings against 34 failures, and 36 homes are currently active there with a median of 51 days on market. Plenty of competition, but plenty of buyers.
At $850,000, the counting comes back very differently. Thirteen closings against 19 failures, and 10 homes currently active with a median of 85.5 days. Part 5 covers that band in full.
The same exercise explains why the per-foot number felt safe to so many of the 144 sellers who failed. At $267 per square foot they were inside the local range. At $534,748 total they were above the price at which most Fort Washington buyers were transacting. Both things were true at once, and only one of them mattered.
The ceiling is a monthly payment
Total price behaves as a ceiling because buyers do not shop in total price. They shop in monthly payment, and the payment is set by the rate.
Per Freddie Mac's survey for the week ending September 17, 2026, the 30-year fixed averaged 6.95% and the 15-year fixed 6.26%. That was up from 6.76% the prior week and from 6.65% on August 20, 2026, and it compares with 6.26% a year earlier. NAR Chief Economist Lawrence Yun, speaking September 16, 2026, described rates moving from 6% in late February to 7% that week and called 7% "the new normal," citing an oil price shock, inflation, and the federal deficit, while naming job growth as the factor that could sustain buying. The Associated Press, on September 17, 2026, summarized it as mortgage rates brushing 7% and weighing on buyers and sellers.
When the rate rises, the total price a given payment supports falls. The per-foot rate a seller can justify does not change. The total a buyer can reach does. That is the mechanism underneath everything in this post.
The county-level numbers are consistent with it. Per PGCAR's August 2026 report, Prince George's County's median sale price was $445,000, up 1.1% year over year, with 2,134 active listings, up 15.5%, average days on market of 38, up 18.8%, and 687 new pending sales, down 4.2% from July.
What this means if you own a larger Fort Washington home
None of this says a larger home cannot sell here. It says the pricing method has to change.
For a home in the range where most Fort Washington sales happen, per-square-foot comparison works reasonably well. For a home well above the 1,716 square foot median, the more useful question is not what rate per foot the seller can justify. It is how many buyers in this market are actually shopping at that total number, and how many homes they are choosing among.
That is an inventory question, and it is answerable. As of September 17, 2026, Fort Washington had 115 active listings with a median list price of $499,900, a median days on market of 43, and 50% having already cut price. Knowing how many competitors sit at your number matters more than knowing your rate per foot.
If you own a larger home in Fort Washington
If your home is above the local median in size and you are considering a listing, the per-square-foot math is not the check you need. Donnell Williams Jr. will show you how many buyers closed at your total number in 2026, how many listings failed at it, and what is competing with you right now. Call 301.818.0313 or email donnell@dmvprimerealty.com. DMV Prime Properties is at 12815 Old Fort Road, Suite 105 in Fort Washington.
Part 5 of The Fort Washington Files goes inside the band with the 59.4% fail rate, the only one in the zip code where more listings failed than sold.


.png)

.png)